SIGNAL · 2-WEEK PREDICTABILITY TEST
Prove your churn and expansion were predictable.
In two weeks, on your own data, we replay your last year with the outcomes hidden, then show you what we would have called before it happened.
- 1,900 €
- One-shot, excl. VAT
- 2 weeks
- From extract to readout
- 1 extract + ~1h
- Your total effort
HOW IT WORKS
We replay your history and keep score.
We take what was known at a point in time, hide everything after it, and score every account. Then we check what actually happened.
What we know
everything up to date t
observed events
Will they churn or grow?
The result: a portfolio-wide number, in euros, on your own data, before you commit.
THE PREDICTABILITY BACKTEST
The signal is measurable.
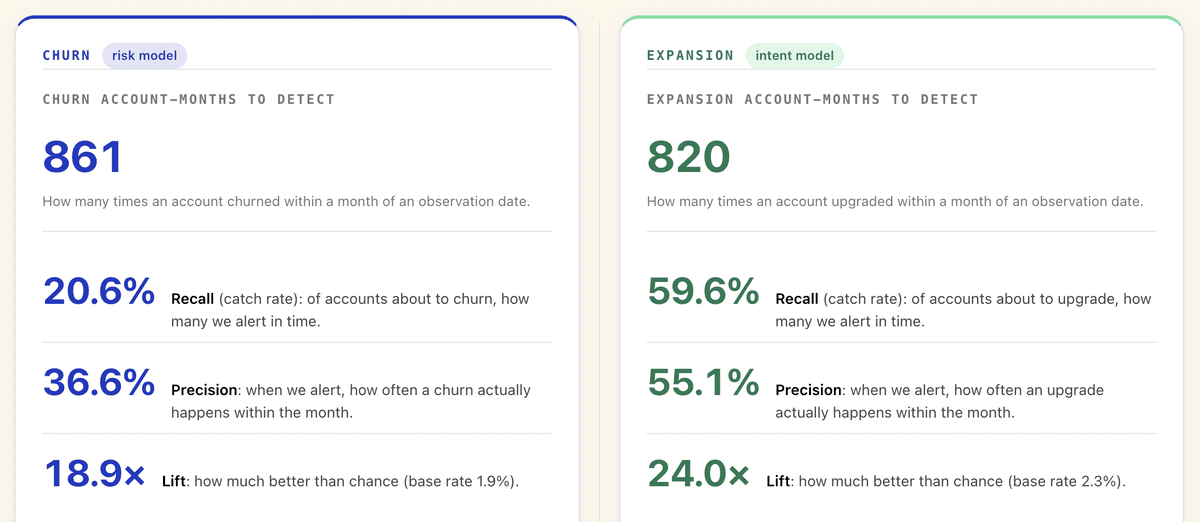
Here is what the backtest returns. Two models, scored monthly, one month ahead.
Churn
risk model861 churn account-months to detect
Expansion
intent model820 expansion account-months to detect
Measured on a simulated B2B CRM SaaS dataset (ChurnSim, Gold, SSRN 2023): 12 months of history, a 1-month horizon, one score per account per month, at the F1-optimal threshold. Your board is computed the same way, on your data.
SIMULATED ACCOUNTS · SCORED MARCH 2, 2026
Two accounts. Same plan. Same renewal date.
On paper, twins. One is about to leave, one is about to surge. Could you tell which?
What the usage data already knew
ACCOUNT ATLAS
Churn drivers
Tenure in the silent-churn zone
351 days, nearing the 1-year disengagement mark
Meeting cadence has stalled
7-day momentum near zero against the 90-day pace
Locked in a 6-month billing cycle
no interim invoice, so disengagement runs unchecked
Scheduling volume is fading
30-day activity far below the 90-day pace
ACCOUNT BLOOM
Expansion drivers
Seat ceiling hit
100% seat use, 0 of 25 left
Intense recent engagement
meeting, edit and search activity surging
Actively working the pipeline
opportunity activity rising over 30 days
New but fast-ramping
76 days in, all 25 users active
THE CALL · SIMULATED CHURNSIM ACCOUNTS
14 days before renewal, the call was already made.
Two probabilities, two verdicts, two euro figures, while both still looked identical on the invoice.
Atlas
15.8%
churn probability
2.2% on Feb 2, then 15.8% on Mar 2: eight times the 1.9% base rate, and rising.
pre-renewal save
Bloom
96.5%
expansion probability
Model score on Mar 2, the observation date.
estimated upside, upgrade to Advanced
What actually happened
Atlas churned March 16
Flagged 2 weeks earlier, on Mar 2.
Bloom laddered Standard → Advanced → Premier
Two upgrades in six weeks.
WHAT YOU KEEP
The deliverable: the Signal Board.
Everything we build to run the backtest is yours.
Metrics Table
One row per account, your metrics, computed from your raw events.
Top Drivers
The behavioural signals that most separate churn from expansion.
Executive Readout 60 min
A live walkthrough, plus a shortlist of actions for the next 90 days.